As fairly heavy user of
lighthouse, the flexibility of
lighthouse to be used just about anywhere is one of its great benefits. Want to
use it in some tests? Sure, you can do that. Want to use it directly in Chrome?
Yep, you can do that in DevTools. Inside docker? Sure thing.
Lately however I’ve been wanting to quickly iterate on some various test
enviroments looking for specific performance wins. Knowing this, I didn’t really
want to go back and forth between reports or the CLI. I really just wanted to
run lighthouse as a task in VS Code and see some output, and then continue
working or pushing upstream.
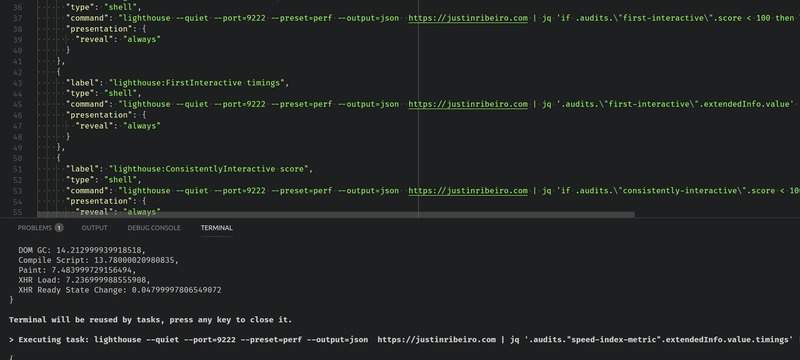
To handle this case, I came up with a fairly generic tasks.json file that runs
various lighthouse-cli commands, pipes them through jq, and then displays them
in the VS Code panel. This results in the output in the screenshot below.
Simple, to the point.
The tasks are a little lengthy (and you could easily update or write specific
tasks for your needs). In the example below and in the gist, I’m firing up my
chrome-headless docker
image to run that
tests against (as denoted by the --port flag in the lighthouse command), but
you can easily remove it and just run against your local instance of chrome
should you wish.
You’ll also need to search/replace the URL in the and point to your test or
staging env (which one can hope matches the running conditions of your prod
env).
{
// Some basic lighthouse testing using docker, lighthouse-cli, jq, tr Note,
// you must search/replace the test url (no var support in tasks.json
// currently)
"version": "2.0.0",
"tasks": [
// NOTE: you don't have to run the container to make this work, you can
// simply change the lighthouse commands as required below to work with your
// setup (I find the container easier)
{
"label": "Start chrome-headless docker container",
"type": "shell",
"command": "docker run -p 9222:9222 --security-opt seccomp=$HOME/chrome.json --name chrome-headless justinribeiro/chrome-headless",
"presentation": {
"reveal": "never"
}
},
{
"label": "lighthouse:FMP score",
"type": "shell",
"command": "lighthouse --quiet --port=9222 --preset=perf --output=json https://example.com | jq 'if .audits.\"first-meaningful-paint\".score < 100 then \"FAIL: FMP score too low!\", .audits.\"first-meaningful-paint\".score else \"SUCCESS: FMP looks good!\", .audits.\"first-meaningful-paint\".score end' | tr -d '\"' ",
"presentation": {
"reveal": "always"
}
},
{
"label": "lighthouse:FMP timings",
"type": "shell",
"command": "lighthouse --quiet --port=9222 --preset=perf --output=json https://example.com | jq '.audits.\"first-meaningful-paint\".extendedInfo.value.timings' | tr -d '\"' ",
"presentation": {
"reveal": "always"
}
},
{
"label": "lighthouse:FirstInteractive score",
"type": "shell",
"command": "lighthouse --quiet --port=9222 --preset=perf --output=json https://example.com | jq 'if .audits.\"first-interactive\".score < 100 then \"FAIL: FirstInteractive score too low!\", .audits.\"first-interactive\".score else \"SUCCESS: FirstInteractive looks good!\", .audits.\"first-interactive\".score end' | tr -d '\"' ",
"presentation": {
"reveal": "always"
}
},
{
"label": "lighthouse:FirstInteractive timings",
"type": "shell",
"command": "lighthouse --quiet --port=9222 --preset=perf --output=json https://example.com | jq '.audits.\"first-interactive\".extendedInfo.value' | tr -d '\"' ",
"presentation": {
"reveal": "always"
}
},
{
"label": "lighthouse:ConsistentlyInteractive score",
"type": "shell",
"command": "lighthouse --quiet --port=9222 --preset=perf --output=json https://example.com | jq 'if .audits.\"consistently-interactive\".score < 100 then \"FAIL: ConsistentlyInteractive score too low!\", .audits.\"consistently-interactive\".score else \"SUCCESS: ConsistentlyInteractive looks good!\", .audits.\"consistently-interactive\".score end' | tr -d '\"' ",
"presentation": {
"reveal": "always"
}
},
{
"label": "lighthouse:ConsistentlyInteractive timings",
"type": "shell",
"command": "lighthouse --quiet --port=9222 --preset=perf --output=json https://example.com | jq '.audits.\"consistently-interactive\".extendedInfo.value' | tr -d '\"' ",
"presentation": {
"reveal": "always"
}
},
{
"label": "lighthouse:SpeedIndex score",
"type": "shell",
"command": "lighthouse --quiet --port=9222 --preset=perf --output=json https://example.com | jq 'if .audits.\"speed-index-metric\".score < 100 then \"FAIL: SpeedIndex score too low!\", .audits.\"speed-index-metric\".score else \"SUCCESS: SpeedIndex looks good!\", .audits.\"speed-index-metric\".score end' | tr -d '\"' ",
"presentation": {
"reveal": "always"
}
},
{
"label": "lighthouse:SpeedIndex timings",
"type": "shell",
"command": "lighthouse --quiet --port=9222 --preset=perf --output=json https://example.com | jq '.audits.\"speed-index-metric\".extendedInfo.value.timings' | tr -d '\"' ",
"presentation": {
"reveal": "always"
},
"problemMatcher": []
},
{
"label": "lighthouse:MainThread breakdown",
"type": "shell",
"command": "lighthouse --quiet --port=9222 --preset=perf --output=json https://example.com | jq '.audits.\"mainthread-work-breakdown\".displayValue, .audits.\"mainthread-work-breakdown\".extendedInfo.value' | tr -d '\"' ",
"presentation": {
"reveal": "always"
}
}
]
}
Testing for performance has never been easier, whether you use the example above
or not. Just keep perf testing and looking at those traces!