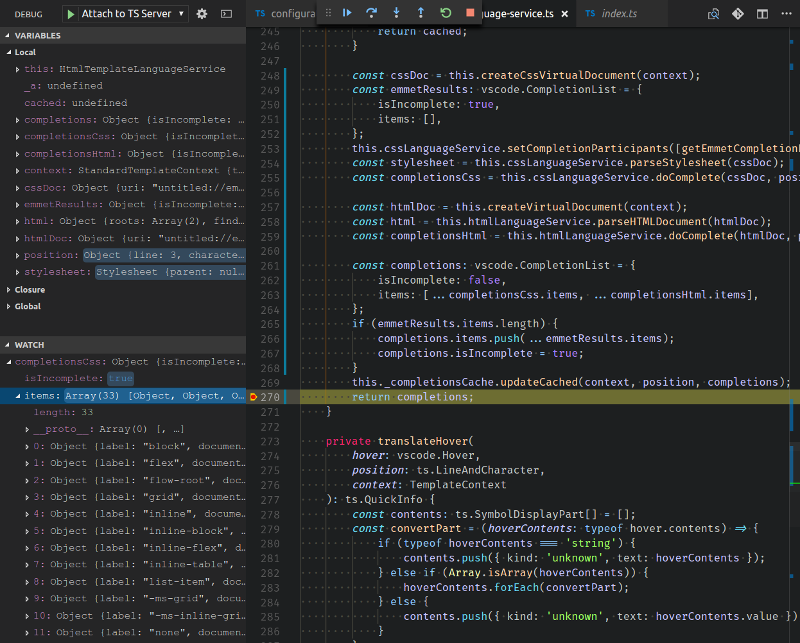
With a little time on my hands before the next project started, I was certain I could implemenet a few features like CSS quickfix and intellisense into typescript-lit-html-plugin. This was going to require debugging the language service, and given the issue ticket title “Debugging Language Service in VS Code” documentation is weird, I didn’t have the highest of hopes for a smooth experience, but in reality I was up and running with very little hiccup.
Let’s walk the steps shall we?
- Download stable VS Code for your platform. You’re going to need this to do the debugging of your language service code.
- Clone the VS Code repo. You’ll need this to run the language server in so that we can debug it from our stable VS Code.
$ git clone git@github.com:Microsoft/vscode.git
- It’s time to build VS Cod. You’ll need a tools for the build chain. Some you likely already have (git, python 2.7x, yarn, node 8), some you may not (C/C++ compiler tool chain, libsecret). I’m running Ubuntu, so I’ve simplified from the wiki:
$ apt install build-essential libx11-dev libxkbfile-dev libsecret-1-dev
$ cd vscode
$ yarn
$ yarn run watch
# open new terminal
$ ./scripts/code.sh
At this point, you should have a build of VS Code running! If not, check for build errors.
- Clone the TypeScript repo.
$ git clone git@github.com:Microsoft/TypeScript.git
- It’s time to build TypeScript.
$ yarn global add jake
$ cd TypeScript
$ yarn
$ jake local
- You’re doing great! Now in the VS Code instance you built, edit the user settings to point at the version of TypeScript your just built:
{
"typescript.tsdk": "/path/to/TypeScript-build/built/local"
}
- Once you’re updated the user settings with the path to the TypeScript server, shutdown your built copy of VS Code and head back to the command line where it was running. Now, we’re going to set an env variable called
TSS_DEBUG and restart our built of VS Code.
$ export TSS_DEBUG = 5888
$ ./scripts/code.sh
- You’re so close now. In stable VS Code, open your language server project. You need a
launch.json that can attach to the TypeScript server that your built that is now running in the version of VS Code you built. So we add one:
{
"version": "0.1.0",
"configurations": [
{
"name": "Attach to TypeScript Server",
"type": "node",
"request": "launch",
"protocol": "inspector",
"port": 5888,
"sourceMaps": true,
"outFiles": ["/path/to/TypeScript-build/built/local"],
"runtimeArgs": [
"--inspect=5888"
]
}
]
}
This will now let us bind and debug!
- In the version of VS Code you built open a folder with a typescript file or other code that you want to debug against. You can now set breakpoints, attach to the TypeScript server through Debug [F5], and walk your code.
- Note, in the case of the
typescript-lit-html-plugin, I tell VS Code that is should be using the plugin by defining it within tsconfig.json:
{
"compilerOptions": {
"noImplicitAny": true,
"plugins": [
{
"name": "/work/src/typescript-lit-html-plugin/lib"
},
]
}
}
Viola! We have debugging take off.

Pretty straight forward. For additional information, do take a look at the docs, which provide some additional context and methods for different debugging senarios.