

When Firebase announced earlier this year that they were bringing real user monitoring of web performance into their stack of tools, I was ecstatic. Another tool to track what real users in the wild are experiencing with an easy setup? Yes, please.
Initially, I heard similar shared excitement. Now six months on since it was announced I can find very little chatter about it, and I’ve not run into anyone who’s tried it.
You’re in luck internet: I’ve been using Firebase web perf tracking since June on this very blog. Let’s take a look at the good, the bad, and the downright confusing portions of the Firebase web performance monitoring beta.
The Good
From the onset, Firebase web performance isn’t there to destroy your existing web performance. The library can be invoked with only the web performance tracking and not load anything related to the database or other Firebase-related products. This may seem like common sense, but then again, the third party web resource community is not exactly known for their light touch.
While there are many setups outlined in the docs, I delay loading the library even further with no detrimental effect. I do load the first input delay polyfill early on page load however (which is the same way I use it when tracking performance with tools like Google Analytics).
From a collection of numbers standpoint, you literally have no code to write beyond the invoke. Install script, verify it’s sending data, wait for numbers to appear in the panel:
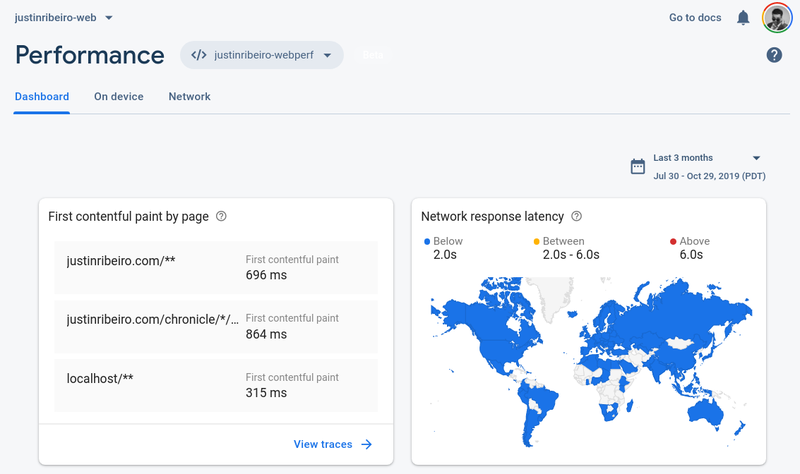
In the screenshot above, we’re looking at three months worth of data from the entire domain. This paints a rather nice picture of performance for both the entire site and the specific blog-entry path, though we need to keep in mind we’re only looking at the median. All the action is in the tails when it comes to performance problems.
If we dive into a particular route, we can get a larger picture of our web performance.
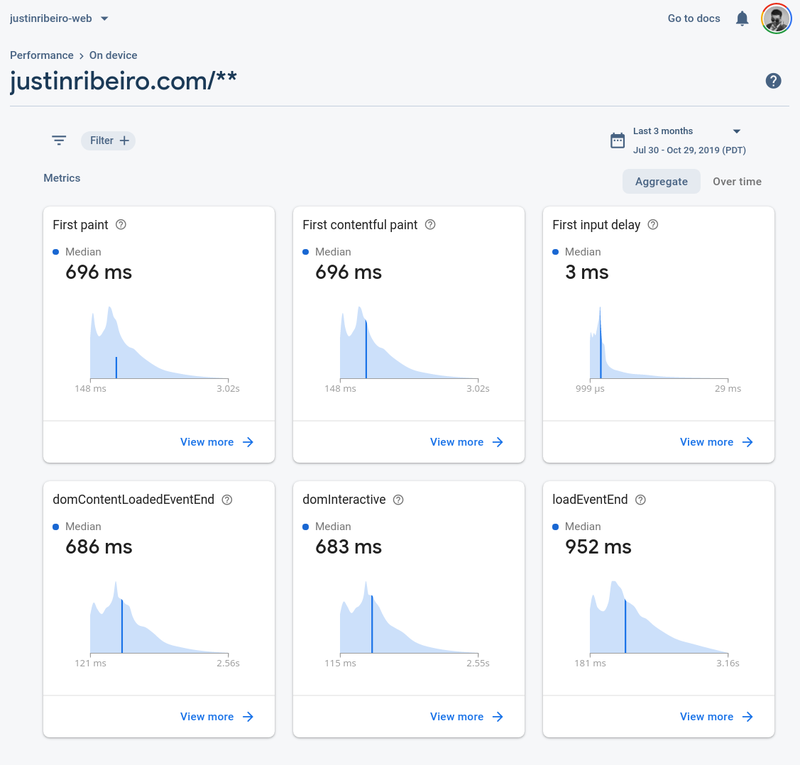
These are the default performance numbers that Firebase Performance SDK will collect for the web. They’ll all probably look familiar if you’ve run a Lighthouse audit or looked a DevTools trace. Good numbers to have generally. Unfortunately, all is not great when it comes to those numbers.
The Bad
While it’s easy to collect numbers the further we dive into the numbers the more difficult it is to actually find actionable data. Actionable data is on the tail, where load times and potential bottlenecks within our web app code could be causing users on certain devices or networks problems. We want the bad cases so we can create fixes.
Let’s take for instance the last three months of First Paints:
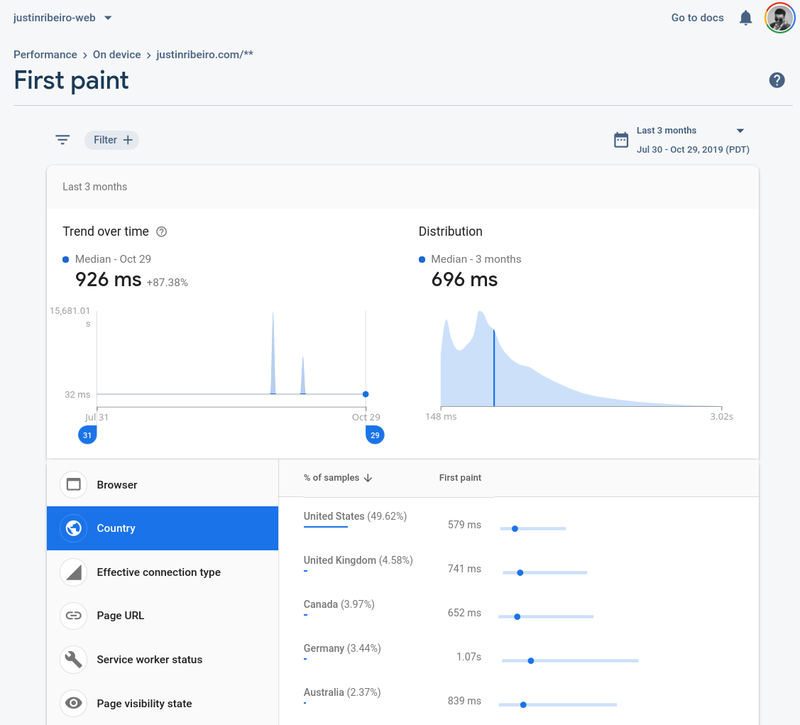
We can move around to see the various percentiles by hovering over the graphs, but we really can’t dive into that tail to see the number of loads or other cross section of information when it comes to what’s going on with these users.
If we filter down into a single country, in the case below India, we see similar tools and not much more information. Shifting the trend over time doesn’t really paint us a better picture, leaving us to guess as to why and how that segment of data might have come to be.
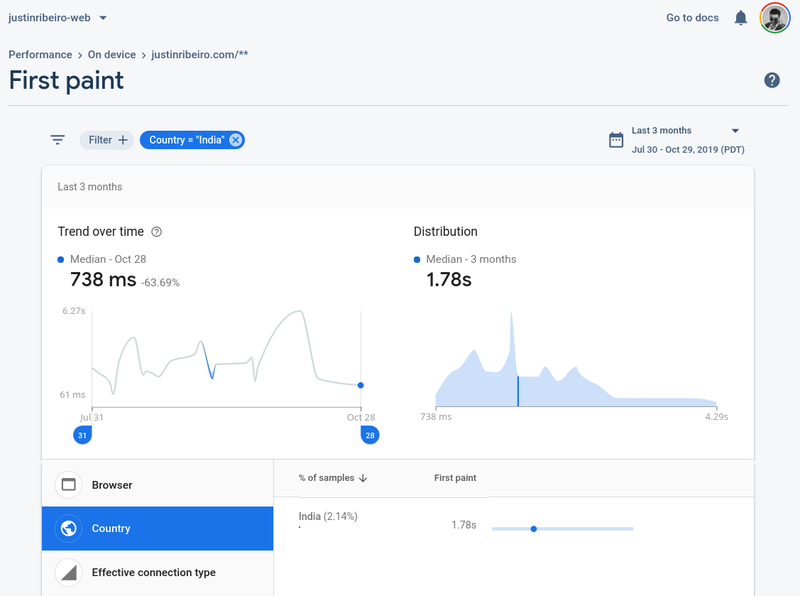
Just export the data and process it you say? I agree, we should do that. Should be the opportune word.
The Downright Confusing
While the data segmentation tools are not great, the more confusing part is the data itself. While the documentation makes note that you can export the data into BigQuery, doing so doesn’t expose the collected data for web performance. The entire dataset is empty and without this working there’s no way to dig into or export the data into other tools.
This is further compounded because you an only see up to the last three months of data within the web UI. My hope is that this is just a case of “it’s a beta, we haven’t enabled all this yet”.
Then there is the question of the User Timing API. I love this API and use it a lot, as the marks and measures surface in my Lighthouse reports and many other custom tools I’ve written. Turns out the Firebase Performance SDK does support them, allowing you to use standard performance.mark and performance.measure to allow them to said data to appears as custom trace numbers in the panel. Note, this isn’t in the documentation but rather briefly makes an appearance in their codelab.
What confuses me is why they felt the need to define their own firebase.performance().trace method, which in combination with start and stop commands, allows custom trace logging. This is documented and it frustrates me. Why not simply use the standard User Timing API? My hunch is this is because people may use this in node outside the browser context, but I would hope this would be clearly defined.
Should You Use Firebase Web Perf SDK
Like most questions of this nature, it depends.
On the one hand, if you want to dabble and start to test the beta on things that aren’t mission critical, I’d say give it a spin. If you aren’t tracking data at all and you want to get a feel for just how your web site or PWA is working in the wild with users, then it’ll give you a pulse. Is it going to be actionable? My gut says no, but only you know how your app works.
If you’re in production right now on a site and you’re thinking you want to track performance, the answer is no. The data reporting and export to BigQuery do no appear to work (and are not documented in relation to their Android/iOS brethren), the panels are not really actionable or allow custom alerts to be set. It’s just not ready for prime-time. There are significantly better tools out there for monitoring web perf RUM; I recommend Speedcurve if you’re doing anything at scale.
Regardless of the gaps and initial issues with the beta, I applaud any company that’s will to take on web performance tracking and monitoring. It’s not easy to roll your own and often the alternatives are terrible.
While Firebase Performance SDK for the web is clearly a work-in-progress, I’m hoping that it improves. The more awareness we have about web performance, the more I’m hoping we can make the web faster and better for more users around the world.