

When it comes to diagnosing web performance problems, you do a lot of living in DevTools. Between the Performance Tab and the all powerful chrome://tracing, these are the sorts of things I work with on a daily basis.
The problem with living in this paradise of useful information is that the information has a tendency to only make sense to a few folks. When you talk to upper management, traces tell a story that visually can be hard to decipher in bit sized meetings.
Pictures of traces speak a thousand words. Video of what a user is experiencing get resources assigned to fix web performance problems.
In a perfect world, I’d have WebPageTest just rolling runs at my behest with video output, but in a lot of on many projects WebPageTest isn’t running internally and testing externally is a non-starter. We need a method to generate some video with some feeling. Enter devtools-to-video.
devtool-to-video is a little cli tool written in node that utilizes ffmpeg to generate a video from a Chrome DevTools trace and put a timer on the bottom that shows the time progression. An example of the video output:
This is similar in concept to WebPageTest though their output video timer is way cooler. This simply utilizes the presentation time (pts) within the ffmpeg to give us a quick means to create the video without a lot overhead via drawtext.
Using devtool-to-video is pretty simple. Install the cli tool via npm or yarn:
Once installed, we have a few command line options to deal with:
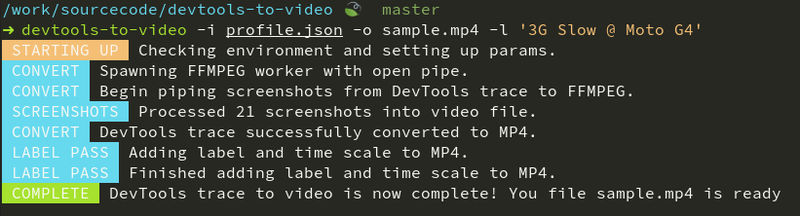
In practice, we generate our trace with screenshots enabled from the performance tab in DevTools, export and download that file, and then run it through our tool:
Take file, show stakeholders, make case that you need better web performance.
Generating a video from a trace is also not a new concept; I used a much more convoluted approach a year or so ago that was just unreliable. Then I saw Kris Selden’s trace-to-mp4.js gist, and my faith in ffmpeg was restored. From there it was just a matter of double passing the video with a filter within ffmpeg (which is it’s own can of worms, but I love ya ffmpeg).
So go out there and trace your sites and apps, and keep making the web faster.