

Folks too often make claims—wild as they may be—that web performance is simple and easy and that their sites and applications are fast. They often lay claim to a perfect lighthouse score with no underlying support from actual performance data in the field, let alone synthetically.
This was made clear after seeing a wacky claim of “speed” from one company I was called into a couple years back. The lighthouse score was showing 100 but users were leaving in troves. The cause? A misconfiguration was causing the 404 page to load and was being measured. The problem? They only believed the score and never traced even after they were having problems.
Which is a long way of saying I don’t much look at the overall lighthouse performance score. I do however read the core web vitals as a gauge since I can line them up on a trace with ease. That ease leads to action—fixes, patches, and changes—that make web performance real for end users.
Which brings us to the mistake I made when it comes to this very web site: the case of a really bad cumulative layout shift regression.
The Numbers Aren’t Lying
While testing the latest version of lighthouse 9, I noticed after an aggregation of 20 or so runs a problem with my cumulative layout shift (CLS). Pulling a characteristic run from that lot, the numbers looked shoddy to say the least, peaking at nearly 1.2 for CLS and a largest contentful paint (LCP) at nearly 3 seconds on a mobile Fast 3G device.
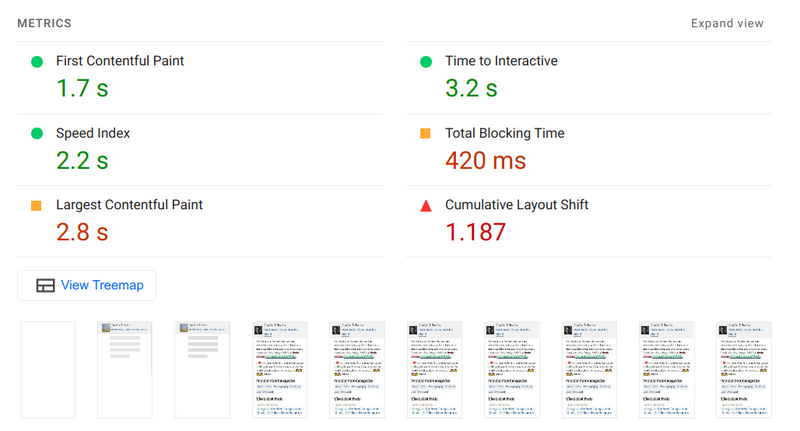
One might be tempted to ignore those bad numbers and look at the rosy side of things and say the site is still very fast. Said person might not be wrong in some contexts, but I am not that person.
Firing up a trace the clarity in the trace was just as stark as the numbers, with clear problems in the layout being recalc’ed and just burning time in a few annoying places.
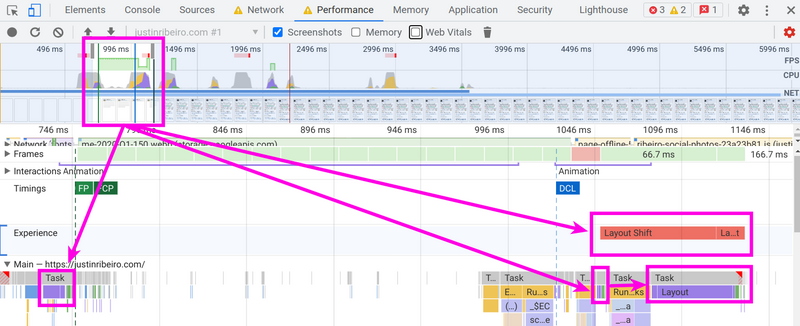
Again, one might look at the above trace and say “you’ve got content on the screen by 1.5 seconds, who cares”. I care. You probably should to given that CLS and other core web vitals have various business impacts.
Having seen the trace I knew that I had at some point made a mistake with my content injector and it was going to need a tune up.
The Hide and Shuffle Fiasco
In the four years of blog-pwa’s existence, I’ve experimented with content injection of various fashions. In the most recent iteration I use a simple skeleton/facade toggle with a content block that takes in various pages types (e.g., static and blog entry) that are little more then web components with custom templates.
The whole setup is devilishly simple and all standard web platform: web components, dynamic imports, and a simple path match is all it takes. Throw in some DOM injection via appendChild and it’s literally just two blocks to manage:
Why the slot in the app shell? The skeleton is styled and used before the component stamp in the DOM for the custom element to give an near instance loading effect for the index.html. I simply reuse that styled DOM via the slot to save myself some effort and to create future content upgrade paths.
The DOM simplicity hides the fact that those two blocks are the problem. For one, I had at some point changed the skeleton to take over the viewport at a min-height of 100vh. In conjunction with hidden as a display: none toggle on said block, I inadvertently created shifting nodes, since the outlet section was never hidden and transitioned into view. A costly unfinished thought of an implementation if I do say so myself.
The fix is straight forward enough: don’t do what I did and invalidate your layout needlessly and shuffle nodes around. To resolve this issue, it’s time to go back to basics.
A Smoother Layer and Experience
If I want smooth, I would need to think about what we can position on the cheap. display will cause the trifecta of not-awesome performance effects in our DOM, trigger layout, paint, composite so we need to steer clear of that if possible. A better approach would be to hint with will-change to tell the browser “hey, I’m going to probably change this element”. Secondly, I’d need to tell setup the what of that change, so I go back to the well of transitioning with opacity, which we still get on the cheap nearly 10 years later.
A little dash of CSS in our web component shell requires telling the browser “hey, let’s make these two blocks perform a little better”. To end users—particularly those on slower devices and networks—they get a smoother overall transition to content without the abrupt shift.
Next, we’ll need to flip that state as required as people move through pages. Since I’m using lit, this is fairly straight forward. One, I always have a state property this.__showSkeleton within my app shell (I think it’s been there for at least 3 years), so I can use classMap() to do the heavy lifting for me by setting up a couple of simple objects:
then apply that object on the respective outlet and skeleton/facade:
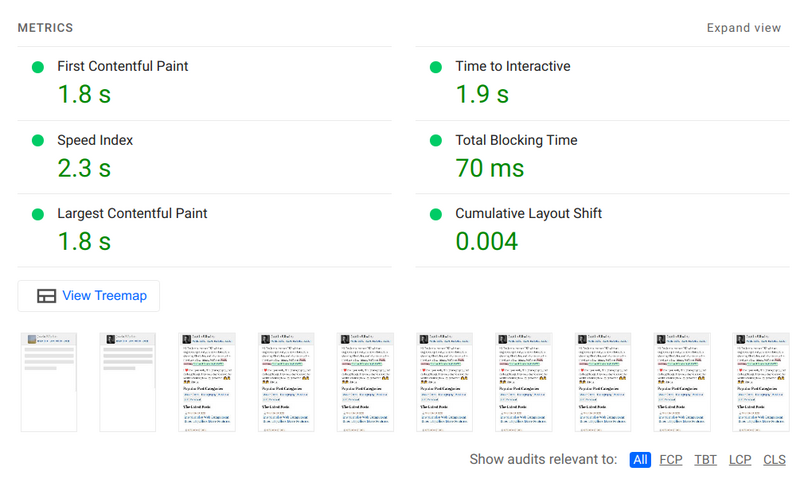
The end result of this seemingly small revision—which I had admit I have had in various forms over the years in that code base—results in both CLS and LCP improvements that become not just a better score but a smoother experience for users.
Conclusions and Thoughts
It would be easy for me to blame many different factors for this regression; I was busy, the tools didn’t tell me, and so forth. I see people blame their frameworks, I see people blame the web platform, I see people blame others.
Such deflection is better known as a cop out and it’s a lame excuse.
In this case, I straight up broke this because I rushed a patch that wasn’t ready for prime time and then I got busy and never went back to it. Not only that, I didn’t follow the very process I put in to prevent such costly regressions.
My web performance gate is pretty simple. My pull requests to the blog-pwa repo get deployed to Google App Engine in 1:1 environment that matches the production setup. Said temporary environment is then tested with my lighthouse github action to verify things did not go terribly wrong. If things look green, I squash the commit down and things move on.
Given the aforementioned setup this regression would have been caught before it ever reached the mainline and production.
So yes, I broke it. It was my fault. I am human and not immune from the trials and tribulations of web performance. I learn from the mistake and seek greener and faster web performance pastures.
There is always improvement to be had. Don’t be scared to look in the mirror and make the changes needed.